Rental
This page isn't public yet.
Enter the password to continue.
RentalEnter the password to continue.
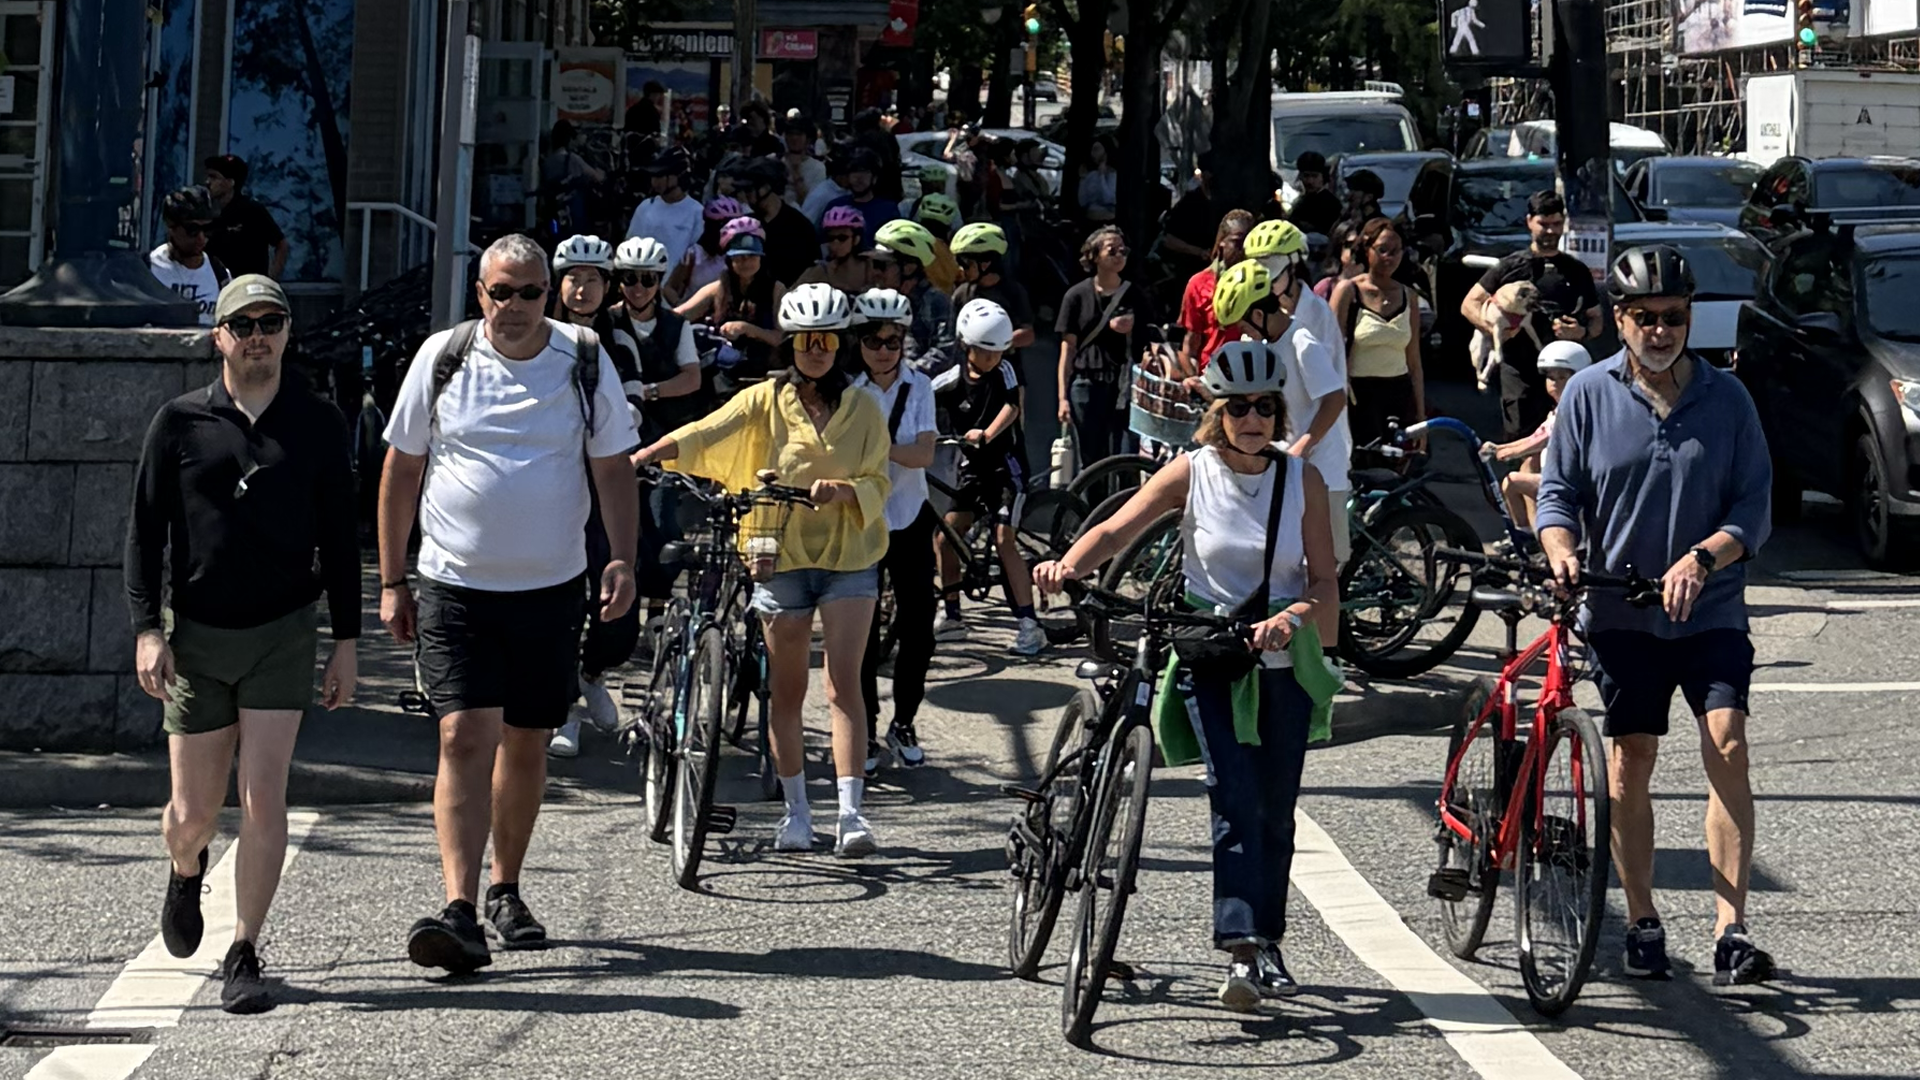
Denman Street sits beside one of Canada's most popular cycling destinations. But before visitors reach Stanley Park, they first have to navigate the transition from rental storefront to cycling network — and that transition happens almost entirely on a public sidewalk, at one of the West End's busiest intersections.
Denman Street runs eight blocks through Vancouver's West End, from West Georgia Street at Stanley Park's Coal Harbour edge down to Beach Avenue at English Bay. At its north end, it is the single most direct walking and cycling connection between the West End's cluster of bike-rental storefronts and the entrance to Stanley Park — home to the 9 km Stanley Park Seawall and roughly 18 million park visits a year A.
The core question this case study investigates: how does a visitor who rents a bicycle around Denman Street actually get from the storefront onto Vancouver's cycling network, and where do pedestrian, bicycle and motor-vehicle conflicts occur during that transition? Section 2 starts with the only part of that question we have hard collision numbers for. Sections 3–5 look at the transition itself, where far less data exists.
Vancouver, BC has no public, point-level, downloadable collision dataset. The numbers below are the most specific figures we could find and verify — reported collisions at named intersections, 2018–2023, sourced from a local outlet's direct query of ICBC's public crash-map data. Read the tier badges: they tell you exactly how confident to be in each number.
Click or tap a marker on the map for its details, figures, and source.
Markers are placed at the real intersection coordinate, independently sourced from OpenStreetMap's Overpass API — not at a fabricated exact crash location. No source used in this study provides exact crash coordinates for Vancouver. This map shows cyclist-involved crashes only across the full Denman corridor, Georgia to Beach/English Bay — all-crash and pedestrian-crash figures for the same intersections are covered in the text and full dataset, not plotted here.
Denman Street & West Georgia Street — described by the source as "the seasonal tourist bike rental zone" — recorded 410 reported collisions of all types between 2018 and 2023, the highest count of any West End intersection in that dataset B. Of those, 11 involved a cyclist B.
That distinction matters: the 410 figure is almost certainly dominated by motor-vehicle-only collisions at a 7-lane, ~60,000-vehicle-a-day arterial A — City of Vancouver, not by rental cyclists. We are not claiming otherwise. What the 11-cyclist figure tells us is narrower but more relevant: cyclists are being struck at the exact intersection this corridor's rental customers must navigate to reach the park.
No year-by-year breakdown, no injury-severity breakdown, and no collision figures at all for Denman & Alberni were available in any source reviewed — see the Sources section for the full limitations list.
Source: The West End Journal (2024-07-01), citing ICBC crash-map data. B
Between "you have a bike" and "you are riding on a cycling facility," a conventional rental typically runs through several stages that happen on the sidewalk, not the cycling network. This is a hypothesis about where friction is likely to occur, not a measured finding — see the box below for what is and isn't backed by evidence.
Store → sidewalk → bike preparation/onboarding → orientation → route decision → cycling network.
Each arrow in that chain is a point where an inexperienced, often jet-lagged, often non-local rider is briefly a pedestrian-space occupant on a bicycle: adjusting a helmet, waiting for the rest of their group, being told where the bike route starts, or deciding which way to go at an intersection they've never seen before.
Potential consequences of this pattern — again, hypotheses to test, not established facts:
A The City of Vancouver's own Cycling Safety Study (2007–2012 collision data) found that sidewalk-related cycling collisions cluster into two patterns: mid-block, where a vehicle enters/exits a driveway or alley, and intersections, where a vehicle is turning right.
D No dataset anywhere measures rental-specific sidewalk activity on Denman Street — no bike counts, no dwell times, no group sizes. This is the single biggest evidence gap in this study, and it's why Section 8 proposes a field methodology to fill it, rather than inventing a number.
The City of Vancouver has identified this exact stretch of West Georgia — Chilco to Nicola, the block that includes Denman — as a priority "complete street" project since 2017, specifically to improve its walking and cycling connections to Stanley Park, Coal Harbour and the West End.
Source: City of Vancouver, West Georgia Complete Street project page. A
The City ran Phase 1 public consultation in 2017–2018 — 70+ stakeholders, 2,300 residents — with an explicit goal to "enhance walking and cycling connections to Stanley Park, West End, Coal Harbour, and Downtown." A planned Phase 2 (transportation options, street-design choices) was scoped for 2019–2020; we could not confirm from public pages whether it concluded, or with what recommendation D — open question, not resolved here.
It's easy to look at 7 lanes and a reversible lane and assume the worst. We're not doing that. What we can support with evidence: this is a high-volume, multi-modal arterial A; the City itself opened a multi-year planning process specifically because current conditions don't work well for people walking and cycling A; and 410 collisions of all types were reported here 2018–2023, more than any other West End intersection in the dataset we found B. That is enough to justify close attention without needing to editorialize further.
A specialist Vancouver cycling-route guide (vanseawall.ca) describes exactly two ways to connect the Denman rental cluster to the Stanley Park / Coal Harbour cycling network B. The map in Section 2 plots the CYKEL suggested route in full, plus Denman Street's own real continuation north of West Georgia to Coal Harbour, at the water.
Ride up Denman St to West Georgia, cross West Georgia at grade, and pick up the painted bike lane to the first segment of the Stanley Park Seawall path, right at the water — described by the route guide as having "traffic, grade, and Georgia Street crossing restrictions." A — City of Vancouver
From 1818 Alberni St, head west on Alberni Street to the end of the road — where it meets an OSM-tagged cycleway and Chilco St's bike route — avoiding the at-grade West Georgia crossing entirely. This now follows Alberni's real street alignment for its full length, ending exactly where the road does, at real cycling infrastructure. A — OpenStreetMap
This is genuine, if non-government, route-guide evidence that an at-grade West Georgia crossing is a real, named friction point on the most direct path — not just our assumption. CYKEL's Alberni St route is our own routing recommendation, not a City-designated bike route D. Whether digital navigation could reliably steer unfamiliar riders toward it instead, and whether that measurably reduces crossings or conflicts, is untested D.
Denman Street's rental cluster — at least four storefronts in an eight-block corridor B — operates in a genuinely constrained public realm: narrow West End sidewalks, high pedestrian volume, and a business model built around fast turnover of groups heading to the park.
We want to be precise about what follows: this is an infrastructure and operational-design observation, not a judgment of any operator. Rental businesses are working within existing sidewalk space and existing processes that long predate this study. No quantitative data exists — from the City, from academic research, or from any source we found — that measures how much sidewalk space rental bikes actually occupy, for how long, or how often. We are not going to manufacture that number. Section 6 of this page proposes exactly how to collect it.
City reports, public-realm studies, cycling studies, and news coverage were all searched for direct evidence of rental-bike sidewalk staging, dwell time, or pedestrian conflict specific to Denman Street. None exists in a form we could verify. The closest adjacent evidence is the City's citywide finding that mid-block driveway/alley conflicts and intersection right-turn conflicts are the two dominant sidewalk-adjacent collision patterns A — relevant context, not corridor-specific proof.
CYKEL is an end-to-end technology platform for bike and e-bike rental operators. The relevant idea here is distributed, digital onboarding: instead of the entire rental process and safety orientation happening at the counter or on the sidewalk, riders complete much of it before they ever arrive.
The hypothesis is straightforward to state and genuinely untested on this corridor: moving onboarding earlier could reduce the amount of operational activity that currently happens between the storefront door and the sidewalk. Section 7 lays the two journeys side by side. Section 8 defines exactly how we'd measure whether that hypothesis holds.
The conventional journey below reflects how rental onboarding typically works based on industry-standard practice, not a timed observation of any specific Denman Street storefront. Amber-tagged steps are the ones most likely to occur on the sidewalk rather than inside the store — the friction points Section 5 discusses. This diagram is a hypothesis to test, not a claim about how much time any step actually takes.
Six of twelve stages (amber) plausibly happen outside the store, in pedestrian space — the segment Sections 3 & 5 focus on.
Designed to move waiver, safety briefing, bike assignment and route guidance earlier in the sequence — before arrival, not on the sidewalk. Some human interaction (fit, questions, group coordination) will still be needed; this is not a fully unattended process.
This comparison is a design hypothesis, drawn directly from CYKEL's platform capabilities, not a measured before/after result — CYKEL has not yet run a pilot on this corridor. See the KPIs in Section 8 for exactly what would need to be measured to test it, and claims-still-to-validate.md for the full list of unproven claims this hypothesis rests on.
These are the KPIs a field study would need to capture — at conventional storefronts first, to establish a baseline, and then again wherever CYKEL-enabled onboarding runs, using the identical method. None of these numbers exist yet. The full data schema and before/after design are documented in the study's methodology notes.
Total time a rental group occupies sidewalk space with bikes, start to finish.
From receiving the bike to entering a marked/designated cycling facility.
Peak number of bicycles simultaneously occupying sidewalk space.
Time a group spends waiting for its slowest member before departing.
Whether a group crosses West Georgia at grade vs. the causeway alternative.
From bike handoff to the group being ready to ride.
Observed conflict or avoidance events per hour of observation.
Whether one group's onboarding visibly obstructs another's, or general foot traffic.
The evidence gathered here supports a narrower claim than "CYKEL makes Denman Street safer." It supports this: Denman & West Georgia is the highest-collision intersection in its area, is explicitly identified by the City as needing better walking and cycling connections, and sits at the exact point where rental customers must transition from a storefront sidewalk onto the cycling network — and no one has ever measured what that transition actually looks like.
Rental technology's usual pitch is operational efficiency for the business. The hypothesis this case study sets up is different: that the same technology — digital onboarding, connected bikes, automatic navigation — could also change how thousands of visitors interact with the public realm around a rental business, for reasons that have nothing to do with the business's bottom line.
Whether that's true is now a testable question, not a claim. Sections 6–8 define exactly how to test it. Until that test happens, this page treats every part of the CYKEL hypothesis as exactly that — a hypothesis.
Full research notes, the complete dataset (GeoJSON), the field-study schema, and the list of claims still requiring validation are published alongside this page. This table covers the primary sources used above.
| Publisher | Dataset / document | Years | Scope | Limitations | Link |
|---|---|---|---|---|---|
| The West End Journal | "A Closer Look," analysis of ICBC crash-map data | 2018–2023 | West End intersections, Vancouver | Secondary source (Tier B); self-reported collisions; excludes parking-lot/parked-vehicle crashes; no per-year or severity breakdown | thewestendjournal.ca ↗ |
| ICBC | Public Tableau dashboards (Lower Mainland Crashes, Intersection crashes) | Rolling ~5-year window | Province-wide, filterable | Primary source; not independently re-extracted in this research pass — interactive dashboard, no CSV export found | public.tableau.com/icbc ↗ |
| City of Vancouver | Cycling Safety Study — Final Report | 2007–2012 | Citywide | Citywide only, not corridor-specific; original PDF blocked to automated access in this pass, read via TRID research index | trid.trb.org ↗ |
| City of Vancouver | West Georgia Complete Street project page | 2017–2018 (Phase 1); Phase 2 status unconfirmed | West Georgia St, Chilco–Nicola | Baseline traffic/cycling counts are the City's own; Phase 2 outcome not confirmed publicly | vancouver.ca ↗ |
| Vancouver Park Board / Shape Your City | Stanley Park Mobility Study | 2022–2025 (approved 2025-09-15) | Stanley Park | No mention found of the Georgia St entrance or Denman St specifically | shapeyourcity.ca ↗ |
| vanseawall.ca | Coal Harbour / Stanley Park route guide | Current | Coal Harbour–West End–Stanley Park cycling routes | Independent cycling-advocacy route guide, not a government traffic study (Tier B) | vanseawall.ca ↗ |
| OpenStreetMap | Overpass API & Nominatim (intersection nodes, POIs) | Current | All map coordinates used on this page | Community-maintained map data; used only for real-world coordinates, not collision data | openstreetmap.org ↗ |
Several "City of Vancouver Open Data Hub" search results referred to Vancouver, Washington, not Vancouver, BC, and were excluded. A blog's paraphrase of a City open-house board (naming "Denman and Pender") could not be corroborated against a primary source and was not used. A peer-reviewed underreporting study was located but blocked from direct access, so no specific underreporting percentage from it is quoted here.